My regular readers (all two of them) will have noticed that I have not posted since the end of August. This is owing to the fact that I don't mess with the blogspot format much and the August posts which remained listed in the side bar to the right amount to an outline of an energy transition that takes us to negative carbon emissions in sufficient time to avoid the most dangerous aspects of global warming. Now you are going to have to click on August to get the scoop. Since that time I've been flogging aspects of the plan around the net as my irregular readers know.
Today is Blog Action Day. So, I'm consigning the plan to the archive to try to contribute to this effort. The theme of Blog Action Day is the environment and the Real Energy Blog is very much concerned with this topic. Energy is such an important aspect of our interaction with the environment that to make positive changes, I feel that we need a new language and mythology about energy. I'm not really inventing this language or mythology. It is already there in the work of Buckminster Fuller or William McDonough or the environmental interviews you can hear on New Dimensions Internet Radio. What I'm trying to do is bring quantitative thinking into this kind of language based on fairly current energy data. Real Energy is participating in natural flows, Ghost Energy is grave robbing. The participation in the action of nature expands your soul. Grave robbing leads to tragedy. Saying this does make people uncomfortable. When I posted congratulations to the IPCC and Vice President Gore on winning the Nobel Peace Prize, I got 14 anonymous moderations of the message with the message going up and down. I take this as evidence that Gore's statement that Global Warming is a spiritual challenge is essentially correct. My message was a polite congratulations that should have received no moderation at all. Instead it became a battle ground of Brownian motion. There is much spiritual energy constellated around Global Warming.
Now, I notice that Andy's Blog Action Day post mentions Tim Flannery who wrote The Weather Makers, and this brings to mind the value of blogs to react to news. Flannery recently made a statement that the IPCC (one of the Peace Prize winners) will soon say that we have already passed the greenhouse gas concentration that will lead to dangerous warming. Within days, the RealClimate Blog came out to say that this is a misinterpretation. This is an example of how the worries that the blogosphere creates more heat than light are unfounded. There are self-correcting mechanisms.
Another example can be found in one of my August posts, where George Monbiot's statement that we might expect 25 meters of sea level rise this century is a misinterpretation of a recent paper in Philosophical Transactions.
A third example, so as not to pick exclusively on Australian activist sites, is a site that is attempting to shut down the nuclear power station at Indian Point in New York. While the aims of the site are quite congruent with the Real Energy Blog, the site has attacked Robert Kennedy Jr. wrongly by saying that he is invested in the company I sell solar power rental contracts for. The company has made it known that this is not the case in short order and comments on the post have cleared this up.
Blogging has a lot of reaction. The right wing blogs seem to be all a twitter about a judge in the UK who ruled that guidance is needed to show Gore's Inconvenient Truth movie there. They seem to be crowing that the judge found errors of fact in the movie. But, when you look at the list (google is your friend) it is clear that the judge was mistaken, and RealClimate has promised [and delivered] a response.
For my contribution to Blog Action Day, I'm going to take the big step of including some images in this blog. The first highlights what I consider to be an important criticism of the IPCC report. What RealClimate does goes in several directions. Correcting Flannery or Monbiot is a small thing. Pointing out that the IPCC report has not relied on the best available data is even more important. This plot from that post: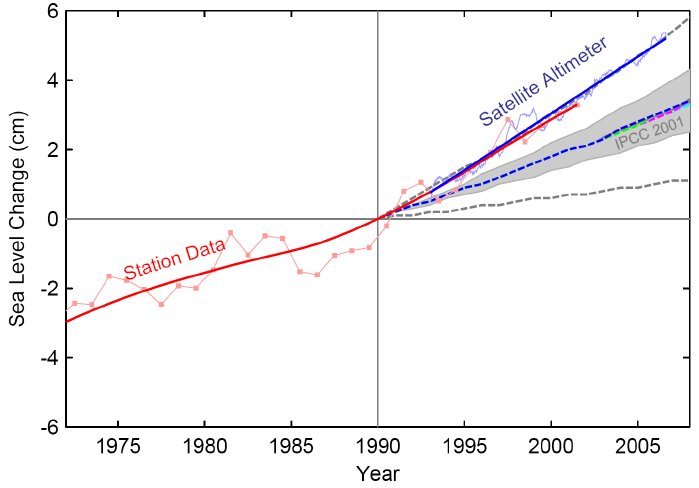
Points out that recent satellite data on sea level change shows a faster rate of increase than used in the IPCC report. So, like the way that polar sea ice is melting faster than anticipated, IPCC projections on sea level rise may be too conservative. James Hansen has been addressing this issue recently by considering the concept of scientific reticence. It may be that the IPCC cannot be relied upon to predict more than trends because warming is happening faster than can be captured using conservative methods. The post at RealClimate suggests 1 meter of sea level rise by the end of the century as a possible lower limit while Hansen has discussed 5 meters of sea level rise by the end of the century. This is 10 times as much as the prediction of the IPCC report.
Now, this correction comes from better data. Since I am not a climate scientist, I thought I would stick my neck out a bit with the following plot and stand ready to be corrected just like Flannery or Monbiot.  Mauna Loa measurements of the annual change in the concentration of carbon dioxide in the atmosphere (thin solid line) together with fossil fuel emissions (thick solid line) and various extrapolations. A linear extraoplation (short-dashed line) reaches dangerous climate change (450 ppm) near the year 2035 (where the line thickens). This and the exponential extrapolation (dot-dashed line) are fits minimizing Chi^2 in linear are log space respectively. The other two lines attempt to match these at the beginning and end of the measurements. They have the functional form of time to the power of time (triple-dot-dashed line) and a Gaussian (long-dashed line). The data point for 2007 is a guesstimate.
This plot is a little different from the sea level plot because it is a rate of change plot. The carbon dioxide in the atmosphere goes up every year but here we just plot the amount it has increased each year rather than the cumulative change. This is a time derivative of the cumulative change measured at Mauna Loa. This is then easy to compare with the amount of carbon dioxide that we emit into the atmosphere each year by using ghost energy as counted by the Energy Information Administration. This is the bit we control. The amount we add to the atmosphere is less than the amount that stays. The place where the thick and thin lines touch is likely accounted for by forest fires in Asia. And, unlike the sea level data, we are not likely to see better data that can help us to refine trends. The ups and downs are real and not a matter of measurement error. But, we can draw the conclusion that, like our emissions, the rate of increase of carbon dioxide in the atmosphere is accelerating. So, we can't really do better projections, and because we control the thick line, everyone uses emissions scenarios to look into the future. But, Flannery's worries lead to a question. Are there natural emissions feedbacks that could go beyond our control that are already underway? The answer is obviously yes if we look on the Asian forest fires as climate related but it is hard to make the case that this in more than a one-off event. So, the question remains open. I think that we can get a clue from the data about how bad such feedbacks could be by fitting a few functions. If there are the beginnings of a feedback, it can't be stronger that the early stages of a rapidly increasing function. So, I've thrown up an exponential function, and one that goes like time to the power of time. I thing that we can say that if such feedbacks are occurring, then they shorten the time to reaching the (nominal) dangerous level of climate change by a few years. On the other hand, if these feedbacks are present in the data, we are already in a dangerous state. It is also worth noting that gradualism is not so helpful. If we slowly reduce our emissions (Gaussian) we still reach the 450 ppm level about 15 years later.
So, that is my contribution to Blog Action Day: A diagram that is meant to spur thought and discussion. It is different from an emissions scenario approach and has some serious flaws compared to that method but it does give a little bit of a constraint on how bad things might be right now. Others might use data on forest fires or carbon uptake into the oceans to derive better constraints, but at that point would we be fitting feedbacks with feedbacks?
Monday, October 15, 2007
Splash plot
Subscribe to:
Post Comments (Atom)

No comments:
Post a Comment